

Determination of ppm Level Ethane in a 60% Methane Background with Nutech 6300 Online NMHC Monitoring System
Background
In liquefied natural gas (LNG) and natural gas processing facilities, particularly those equipped with Nitrogen Rejection Units (NRUs), monitoring trace levels of C2+ hydrocarbons in methane-rich process streams can be important for assessing upstream separation performance and identifying abnormal operating conditions.
In certain applications, C2+ concentrations may normally remain around 30 ppmv, while a sudden increase above 100 ppmv can indicate potential process disturbances that require operator attention. Such applications may specify a measurement range of 0–5,000 ppmv, presenting a significant analytical challenge: accurately detecting low concentrations of non-methane hydrocarbons in the presence of overwhelmingly high methane concentrations.
To evaluate the feasibility of this application, Nutech Instruments conducted a series of tests using the Nutech NCMS 6300 Online NMHC Monitoring System. The evaluation focused on measuring ppm-level ethane in a simulated gas matrix containing 60% methane, with particular emphasis on calibration performance, measurement accuracy, repeatability, and system carryover.
This application note presents the experimental setup and results, demonstrating the potential of the NCMS 6300 for trace hydrocarbon monitoring in methane-rich industrial gas streams.
1 Experimental
1.1 Instruments
1.1.1 NCMS 6300 online NMHC monitoring system (including a zero-air generator and a hydrogen generator) (Figure 1);
1.1.2 Nutech 2208 high-precision diluter;
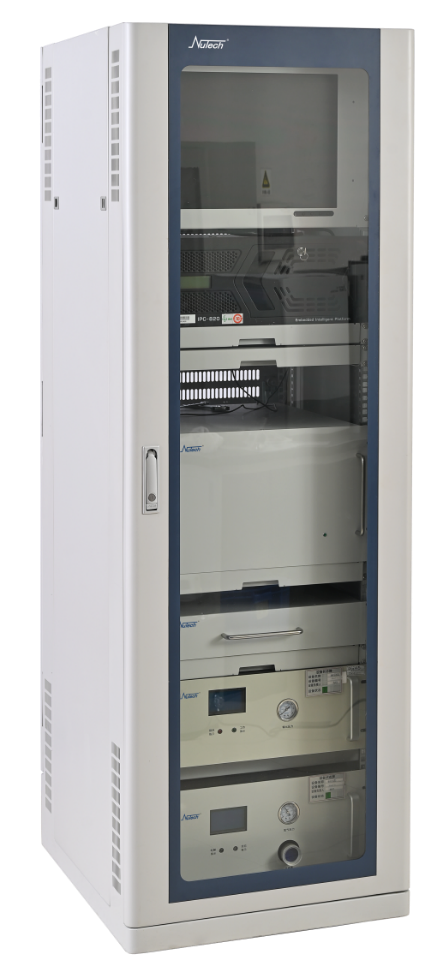
Figure 1 NSCM 6300 online NMHC Monitoring System
1.2 Reagents and Materials
1.2.1 Methane standard gas: 99.999%
1.2.2 Ethane standard gas: 300 ppmv
1.2.3 Nitrogen: purity ≥99.999%
1.2.4 SUMMA canisters: seven 6 L canisters.
1.3 Experimental Conditions
Sample gas flow rate: 20 mL/min; sampling time: 30 s;
Analysis time per sample: ≤15 min;
FID gas settings: air flow rate, 400 mL/min; hydrogen flow rate, 50 mL/min; nitrogen carrier gas flow rate, 40 mL/min.
1.4 Experimental Procedures
1.4.1 Calibration Curve
Use the Nutech 2208 diluter to prepare a series of working standard gases, each containing 60% methane by volume and ethane at 0, 20, 40, 60, 80, and 100 ppmv, respectively, with high-purity nitrogen as the balance gas. Transfer the standards into six separate SUMMA canisters;
1.4.2 Method Precision
Prepare a spiked sample containing 60% methane by volume and 30 ppmv ethane. Perform six consecutive replicate measurements and calculate the relative standard deviation (RSD) of the results and the spike recovery.
1.4.3 System Carryover Assessment
Immediately after analyzing the highest-concentration standard (100 ppmv ethane and 60% methane by volume), introduce and analyze a nitrogen blank. Evaluate system carryover based on the methane and ethane detected.
2 Results and Discussion
2.1 FID Integration Plot
Figure 2 shows the FID responses to separated methane and preconcentrated non-methane hydrocarbons (ethane) under the selected experimental conditions.
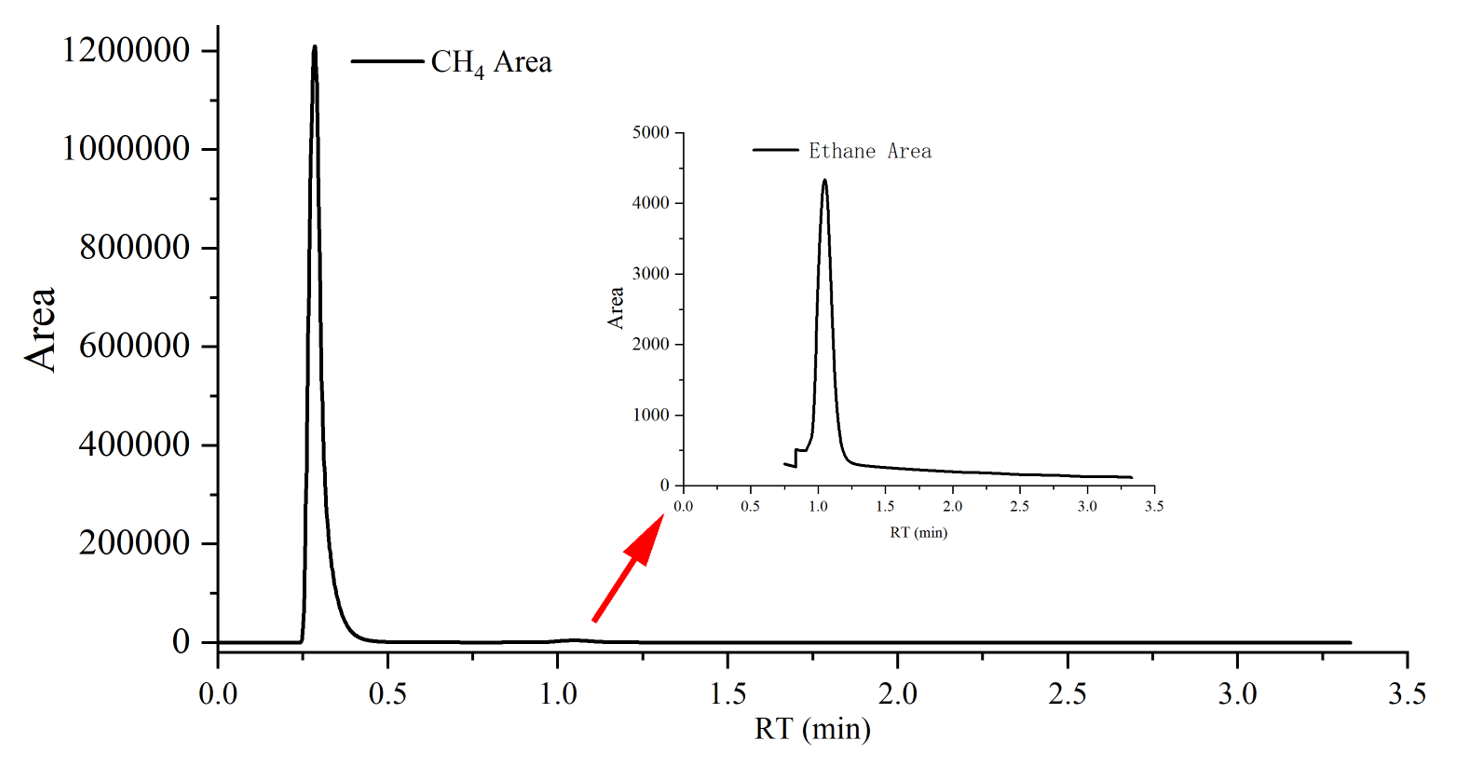
Figure 2 FID responses to methane and non-methane total hydrocarbons
2.2 Calibration Curve
The correlation coefficient R^2 of the ethane calibration curve was 0.9945, indicating good correlation.
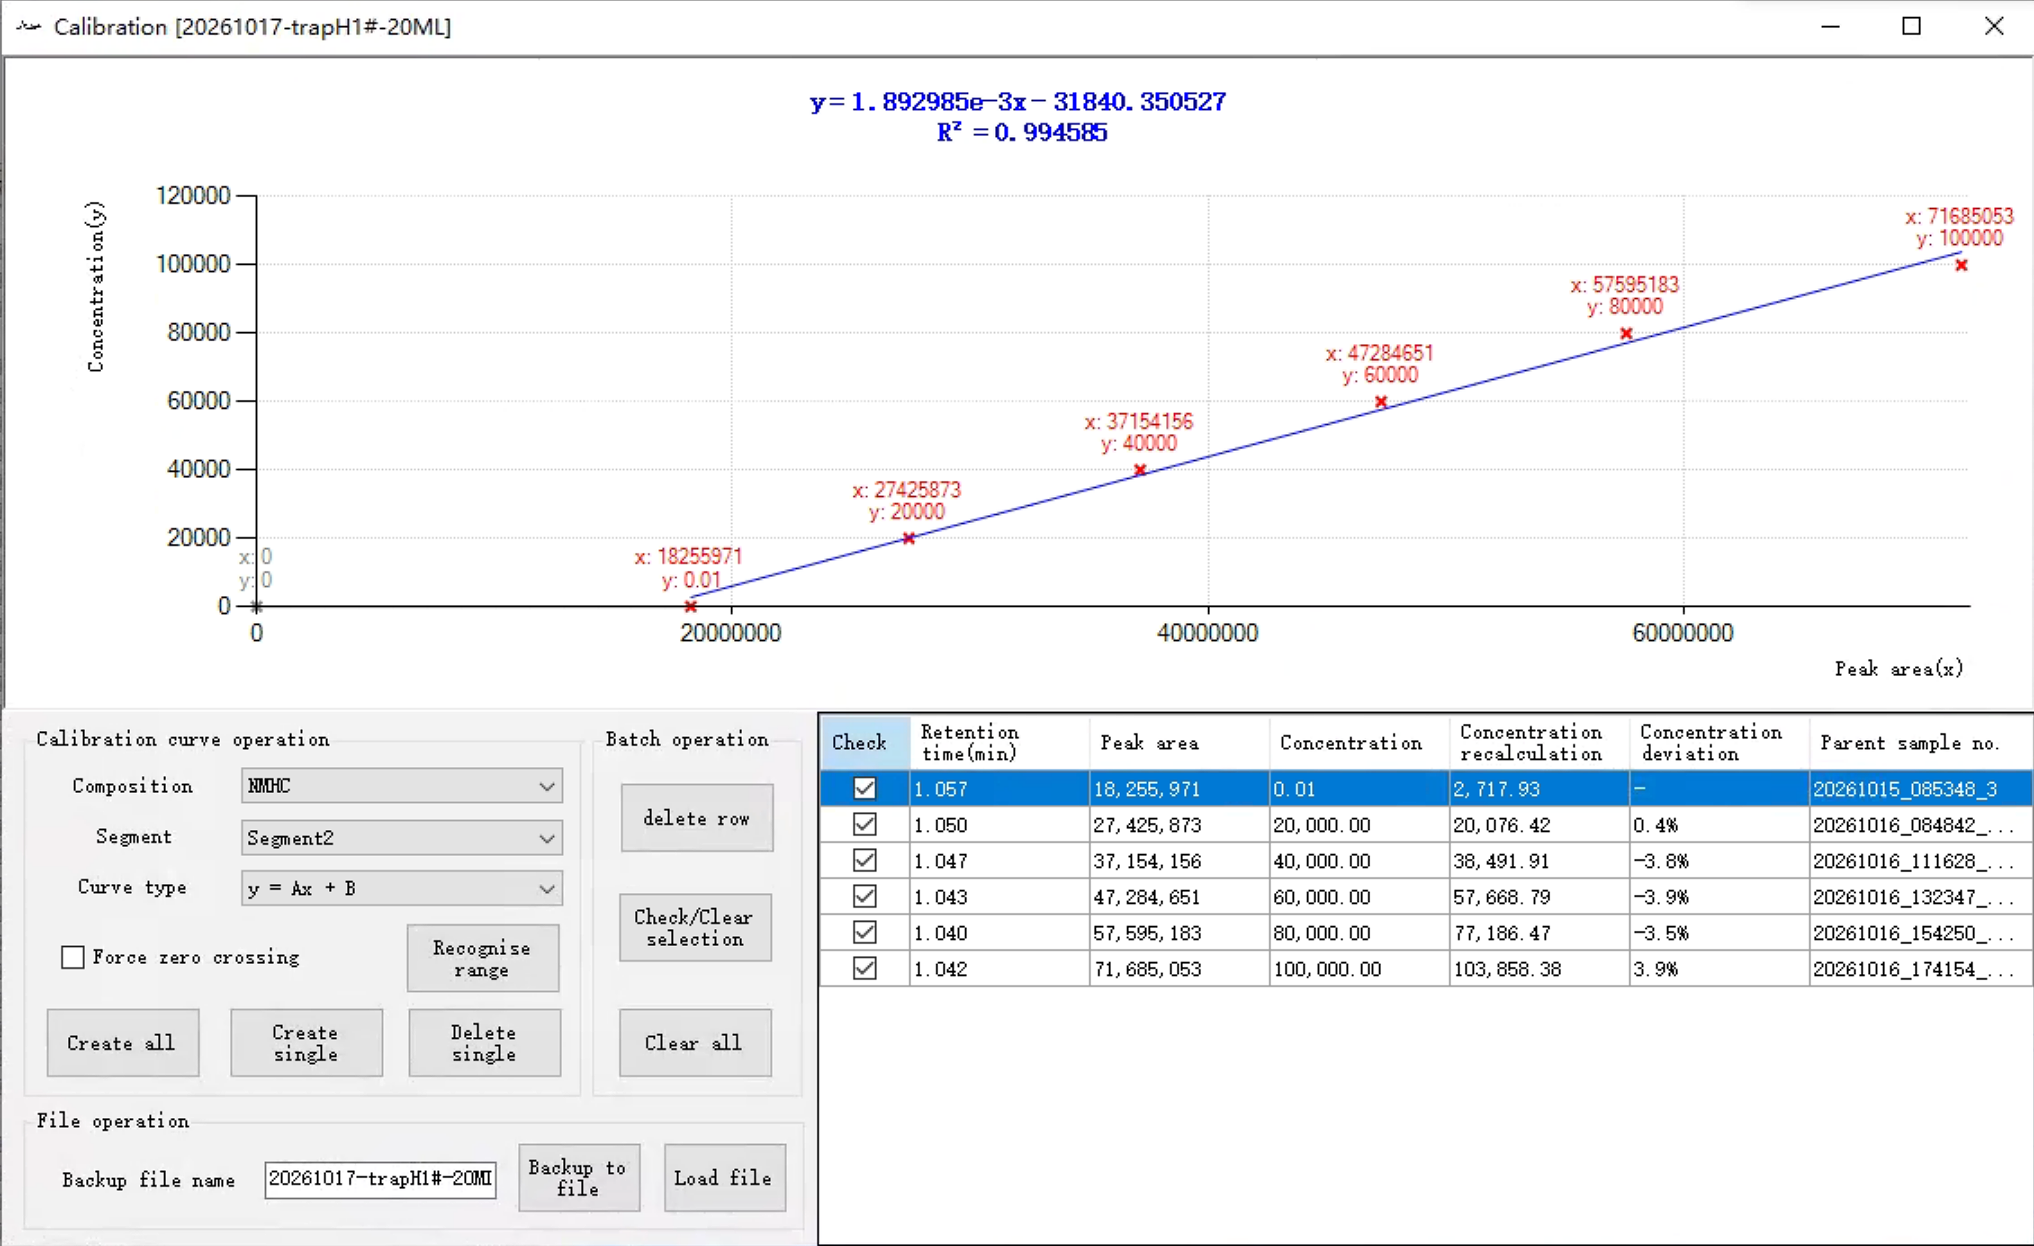
Figure 3 Ethane calibration curve
2.3 Method Precision
A spiked sample containing 60% methane by volume and 30 ppmv ethane was prepared and measured six consecutive times. The relative standard deviation of the ethane results was 0.3%, and the spike recovery was 103.8%. The stability of the methane matrix signal was assessed simultaneously; the relative standard deviation of the methane peak area was 1.33%. The method demonstrated good precision and accuracy.
Table 1 Ethane precision and spike recovery
| Sample name | Component name | NMHC peak conc (ppb) | NMHC peak conc (ppm) | NMHC average value (%) | NMHC accuracy (%) | NMHC precision (%) |
| 20261019_131337_30ppm | (NMHC) | 31034.02 | 31.0 | 31.2 | 3.8% | 0.3% |
| 20261019_133541 | NMHC | 31136.84 | 31.1 | |||
| 20261019_135056 | NMHC | 31219.42 | 31.2 | |||
| 20261019_140613 | NMHC | 31080.23 | 31.1 | |||
| 20261019_142128 | NMHC | 31282.6 | 31.3 | |||
| 20261019_143645 | NMHC | 31171.63 | 31.2 |
2.4 System Carryover Assessment
After analysis of a mixed-gas standard containing 60% methane and 100 ppm ethane diluted with nitrogen, high-purity nitrogen blanks were injected consecutively. The methane and ethane concentrations measured in the first nitrogen blank were 489 ppmv and 0, respectively; those in the second nitrogen blank were 153 ppmv and 0, respectively. The effect of switching from high to low concentration was <1%.
3 Conclusions
A method for determining ppm level ethane (non-methane total hydrocarbons) in a high methane background (60%) was established using the NCMS 6300 online non-methane total hydrocarbon analysis system together with the Nutech 2208 high-precision diluter. For methane, the measurement deviation was ≤8% of the test value, with precision ≤2%; for non-methane hydrocarbons (ethane), the measurement deviation was ≤7% of the measured value, with precision ≤1%. (See the appendix for supplementary data.)
Appendix Additional Data from Testing
Appendix 1 Test data for non-methane hydrocarbon (ethane) standard gas samples at different concentrations
| Sample name | Component name | Peak conc (ppm) | Standard value (ppm) | NMHC accuracy (%) | Peak height | NMHC peak area | Peak retention time |
| 20261015_085348_2 | NMHC | 2.8 | 0 | 2682.48 | 18307122.85 | 1.057 | |
| 20261015_085348_3 | NMHC | 0.0 | 0 | 2668.94 | 18255970.95 | 1.057 | |
| 20261015_085348_4 | NMHC | 0.0 | 0 | 2659 | 18210702.73 | 1.057 | |
| 20261015_085348_5 | NMHC | 2.7 | 0 | 2665 | 18261607.93 | 1.057 | |
| 20261016_084842_20_1 | NMHC | 19.2 | 20 | -3.8% | 3842.67 | 26979880.99 | 1.048 |
| 20261016_084842_20_2 | NMHC | 20.1 | 20 | 0.7% | 3882.65 | 27462823.93 | 1.05 |
| 20261016_084842_20_3 | NMHC | 20.2 | 20 | 0.9% | 3878.04 | 27477979.93 | 1.05 |
| 20261016_084842_20_4 | NMHC | 20.1 | 20 | 0.4% | 3870.94 | 27425873.35 | 1.05 |
| 20261016_111628_40ppm_1 | NMHC | 38.7 | 40 | -3.4% | 5135.13 | 37238442.31 | 1.047 |
| 20261016_111628_40ppm_2 | NMHC | 38.6 | 40 | -3.5% | 5214.32 | 37217746.42 | 1.047 |
| 20261016_111628_40ppm_3 | NMHC | 38.5 | 40 | -3.9% | 5201.82 | 37133375.88 | 1.045 |
| 20261016_111628_40ppm_4 | NMHC | 38.5 | 40 | -3.8% | 5189.94 | 37154156.15 | 1.047 |
| 20261016_132347_60ppm_1 | NMHC | 57.5 | 60 | -4.2% | 6581.34 | 47193362.66 | 1.043 |
| 20261016_132347_60ppm_2 | NMHC | 57.3 | 60 | -4.5% | 6566.67 | 47092653.34 | 1.043 |
| 20261016_132347_60ppm_3 | NMHC | 57.3 | 60 | -4.5% | 6586.03 | 47080254.67 | 1.043 |
| 20261016_132347_60ppm_4 | NMHC | 57.7 | 60 | -3.9% | 6591.93 | 47284651.4 | 1.043 |
| 20261016_154250_80ppm_1 | NMHC | 79.5 | 80 | -0.7% | 8092.25 | 58791905.48 | 1.043 |
| 20261016_154250_80ppm_2 | NMHC | 76.9 | 80 | -3.9% | 7879.32 | 57428100.87 | 1.043 |
| 20261016_154250_80ppm_3 | NMHC | 77.2 | 80 | -3.5% | 8033.12 | 57595182.79 | 1.04 |
| 20261016_174154_100ppm_1 | NMHC | 103.6 | 100 | 3.6% | 9919.93 | 71547117.31 | 1.042 |
| 20261016_174154_100ppm_2 | NMHC | 103.3 | 100 | 3.3% | 9746.66 | 71369155.8 | 1.042 |
| 20261016_174154_100ppm_3 | NMHC | 103.4 | 100 | 3.4% | 9739.55 | 71430727.74 | 1.042 |
| 20261016_174154_100ppm_4 | NMHC | 103.9 | 100 | 3.9% | 9781.38 | 71685053.34 | 1.042 |
| 20261019_100720_1 | NMHC | 3.1 | 0 | 2691.37 | 18467524.21 | 1.058 | |
| 20261019_100720_2 | NMHC | 3.9 | 0 | 2716.67 | 18858438.36 | 1.06 | |
| 20261019_100720_3 | NMHC | 0.0 | 0 | 2498.54 | 17265175.54 | 1.062 | |
| 20261019_131337_30ppm | NMHC | 31.0 | 30 | 3.4% | 4623.65 | 33214407.34 | 1.05 |
| 20261019_133541 | NMHC | 31.1 | 30 | 3.8% | 4601.61 | 33268720.27 | 1.052 |
| 20261019_135056 | NMHC | 31.2 | 30 | 4.1% | 4603.51 | 33312345.81 | 1.052 |
| 20261019_140613 | NMHC | 31.1 | 30 | 3.6% | 4596.46 | 33238814.67 | 1.05 |
| 20261019_142128 | NMHC | 31.3 | 30 | 4.3% | 4607.22 | 33345720.62 | 1.05 |
| 20261019_143645 | NMHC | 31.2 | 30 | 3.9% | 4606.2 | 33287099.23 | 1.052 |
| 20261019_145202 | NMHC | 31.4 | 30 | 4.6% | 4615.58 | 33395372.25 | 1.05 |
| 20261019_150720 | NMHC | 31.9 | 30 | 6.2% | 4646.68 | 33652029.2 | 1.05 |
| 20261019_152238 | NMHC | 31.7 | 30 | 5.5% | 4639.85 | 33543217.04 | 1.05 |
| 20261019_153755 | NMHC | 31.3 | 30 | 4.3% | 4613.26 | 33346145.3 | 1.052 |
| 20261019_155310 | NMHC | 31.6 | 30 | 5.5% | 4639.76 | 33534032.61 | 1.052 |
| 20261019_160826 | NMHC | 31.9 | 30 | 6.4% | 4664.93 | 33679554.02 | 1.05 |
Appendix 2 Single-point methane calibration
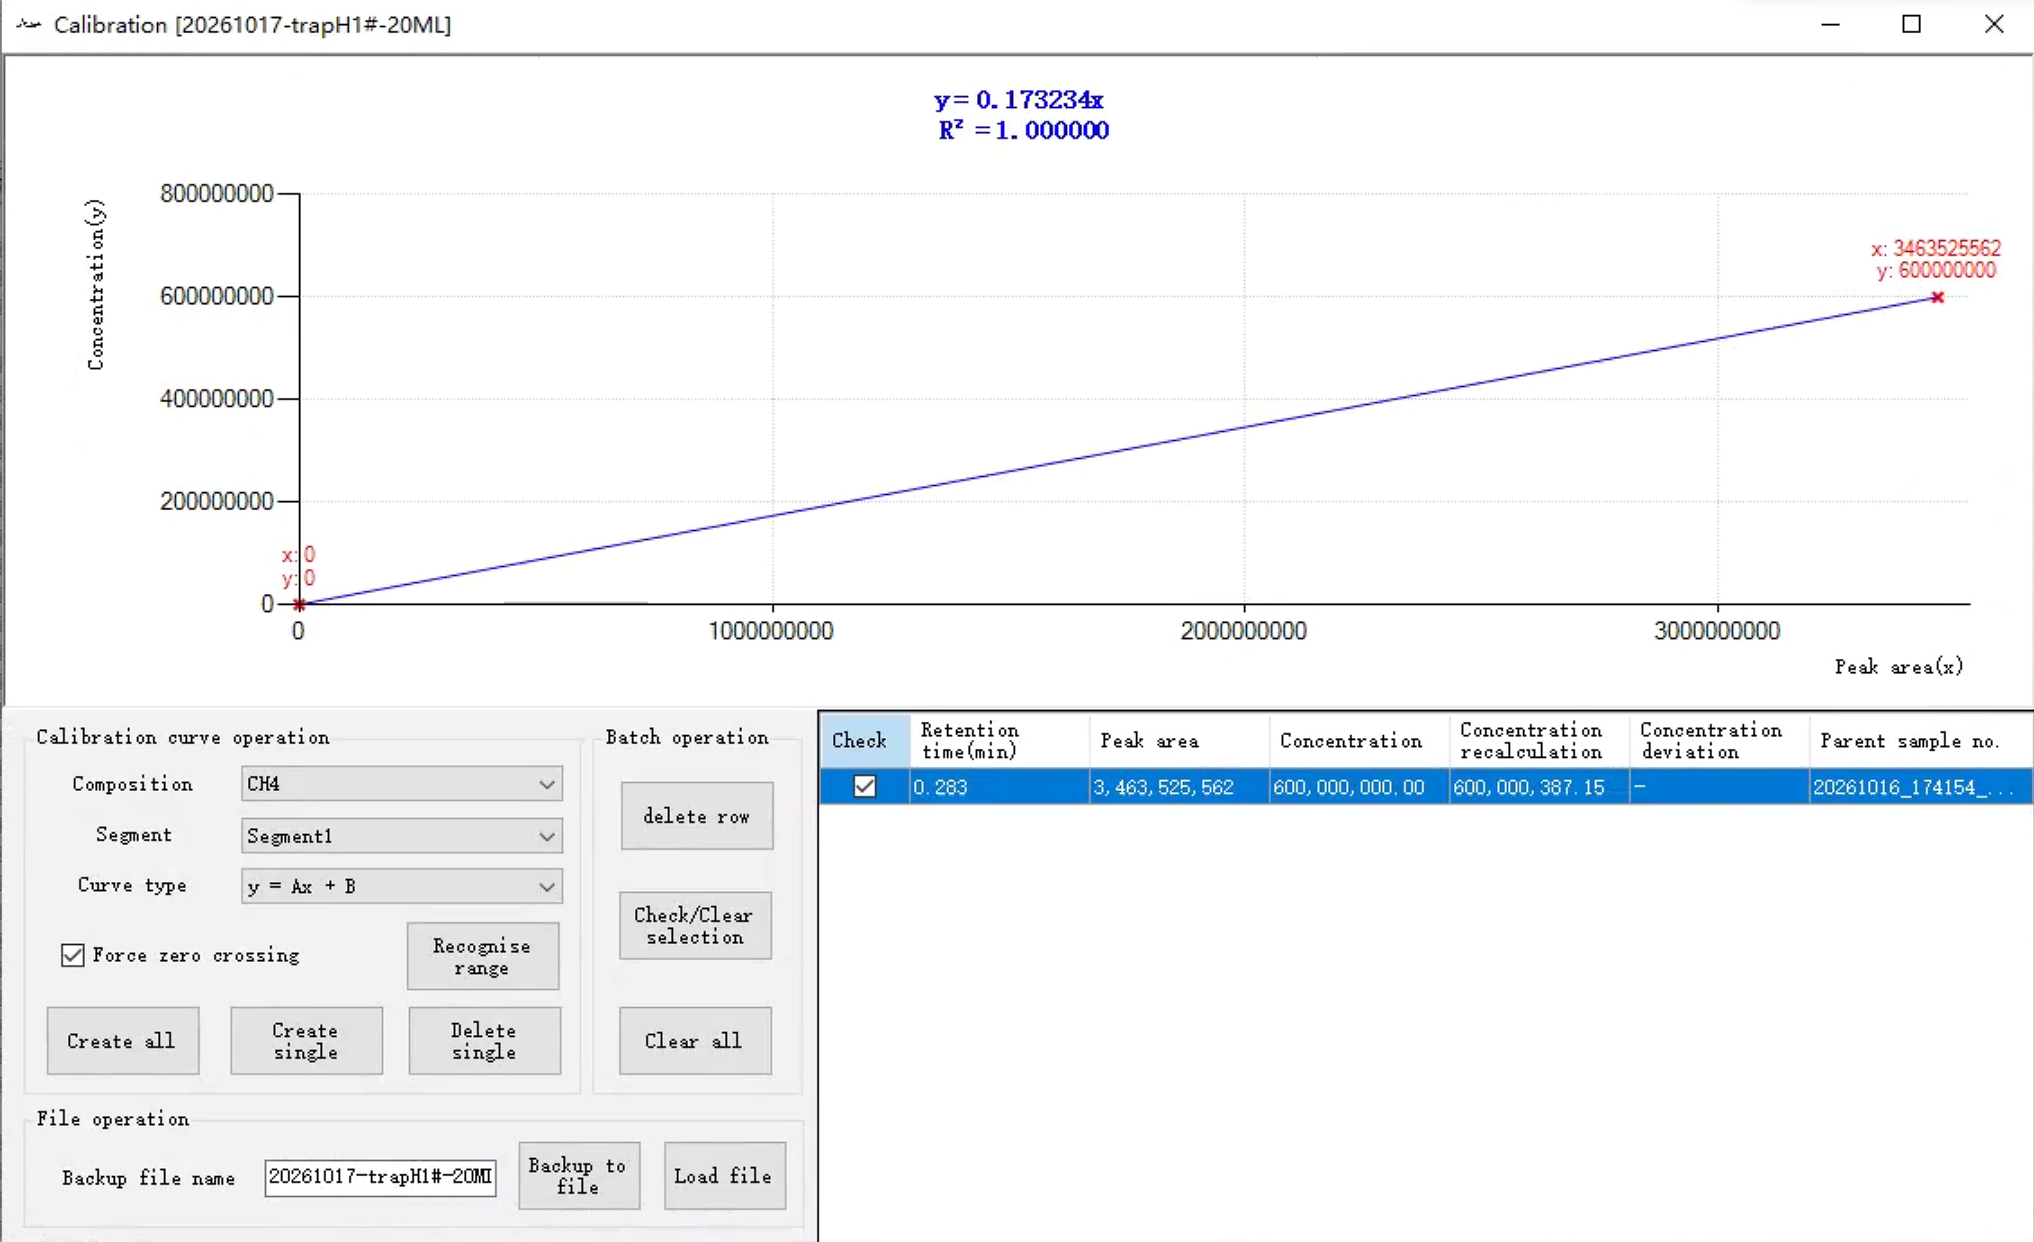
Methane single-point calibration as recorded in the original test
Appendix 3 Corresponding methane test results
| Sample name | Component name | Peak conc (%) | Standard value (%) | CH4 accuracy (%) | Peak height | CH4 peak area |
| 20261015_085348_2 | CH4 | 55.1 | 60 | 1149743.27 | 3182757211 | |
| 20261015_085348_3 | CH4 | 55.0 | 60 | 1147522.62 | 3176911070 | |
| 20261015_085348_4 | CH4 | 54.5 | 60 | 1134103.9 | 3147595209 | |
| 20261015_085348_5 | CH4 | 54.6 | 60 | 1138616.2 | 3152696227 | |
| 20261016_084842_20_1 | CH4 | 58.3 | 60 | -2.8% | 1214622.77 | 3364823609 |
| 20261016_084842_20_2 | CH4 | 58.1 | 60 | -3.1% | 1210224.66 | 3355972953 |
| 20261016_084842_20_3 | CH4 | 57.8 | 60 | -3.6% | 1204609.57 | 3337473546 |
| 20261016_084842_20_4 | CH4 | 57.0 | 60 | -5.0% | 1186196.38 | 3288931181 |
| 20261016_111628_40ppm_1 | CH4 | 57.3 | 60 | -4.5% | 1194300.31 | 3307885085 |
| 20261016_111628_40ppm_2 | CH4 | 57.7 | 60 | -3.9% | 1200814.64 | 3329939925 |
| 20261016_111628_40ppm_3 | CH4 | 57.3 | 60 | -4.4% | 1195654.15 | 3309461212 |
| 20261016_111628_40ppm_4 | CH4 | 57.1 | 60 | -4.8% | 1188659.8 | 3295602328 |
| 20261016_132347_60ppm_1 | CH4 | 57.7 | 60 | -3.8% | 1202706.13 | 3333082518 |
| 20261016_132347_60ppm_2 | CH4 | 58.0 | 60 | -3.4% | 1206329.51 | 3345477940 |
| 20261016_132347_60ppm_3 | CH4 | 57.3 | 60 | -4.5% | 1194560.33 | 3308057718 |
| 20261016_132347_60ppm_4 | CH4 | 57.9 | 60 | -3.6% | 1206000.76 | 3340388167 |
| 20261016_154250_80ppm_1 | CH4 | 56.0 | 60 | -6.6% | 1168762.3 | 3233390660 |
| 20261016_154250_80ppm_2 | CH4 | 56.9 | 60 | -5.2% | 1184518.32 | 3282537062 |
| 20261016_154250_80ppm_3 | CH4 | 56.8 | 60 | -5.4% | 1184782.33 | 3277098945 |
| 20261016_174154_100ppm_1 | CH4 | 60.1 | 60 | 0.1% | 1107343.72 | 3468261203 |
| 20261016_174154_100ppm_2 | CH4 | 60.1 | 60 | 0.2% | 1119497.13 | 3468774761 |
| 20261016_174154_100ppm_3 | CH4 | 60.0 | 60 | 0.0% | 1120366.36 | 3464171246 |
| 20261016_174154_100ppm_4 | CH4 | 60.0 | 60 | 0.0% | 1115999.05 | 3463525562 |
| 20261019_100720_1 | CH4 | 57.5 | 60 | 1194849.67 | 3319004417 | |
| 20261019_100720_2 | CH4 | 56.1 | 60 | -6.6% | 1167379.43 | 3236449380 |
| 20261019_100720_3 | CH4 | 59.9 | 60 | -0.2% | 1244940.81 | 3457432733 |
| 20261019_131337_30ppm | CH4 | 58.7 | 60 | -2.2% | 1220318.68 | 3388812555 |
| 20261019_133541 | CH4 | 56.8 | 60 | -5.3% | 1182596.21 | 3280343197 |
| 20261019_135056 | CH4 | 56.6 | 60 | -5.6% | 1177510.63 | 3269321477 |
| 20261019_140613 | CH4 | 57.0 | 60 | -5.0% | 1185327.06 | 3288682579 |
| 20261019_142128 | CH4 | 57.1 | 60 | -4.9% | 1187009.72 | 3294489273 |
| 20261019_143645 | CH4 | 56.9 | 60 | -5.2% | 1183483.86 | 3283279237 |
| 20261019_145202 | CH4 | 56.9 | 60 | -5.1% | 1185163.71 | 3285237771 |
| 20261019_150720 | CH4 | 57.4 | 60 | -4.3% | 1194077.21 | 3313482272 |
| 20261019_152238 | CH4 | 57.1 | 60 | -4.8% | 1187303.68 | 3296228865 |
| 20261019_153755 | CH4 | 55.9 | 60 | -6.8% | 1163396.27 | 3226728182 |
| 20261019_155310 | CH4 | 55.7 | 60 | -7.2% | 1158725.06 | 3212798506 |
| 20261019_160826 | CH4 | 56.0 | 60 | -6.6% | 1165776.51 | 3233750861 |