

Analysis of 11 Odor Related Compounds in Air Using the Nutech 8910 Preconcentrator and GC-MS
Overview
This application note evaluates canister sampling and Nutech 8910 cryogenic preconcentration coupled with gas chromatography-mass spectrometry (GC-MS) for 11 odor-related compounds in air. The target list comprises ten sulfur-containing compounds and styrene. The laboratory workflow combines canister cleaning, calibration-gas preparation, automated sample introduction, three-stage preconcentration, and GC-MS analysis.
Reported method detection limits were 0.2–0.5 µg/m³, and calibration correlation coefficients r ranged from 0.9994 to 1.0000. All reported relative standard deviations (RSDs) were below 10%. Spike recoveries ranged from 81.61% to 116.70% in nitrogen and from 67.70% to 122.89% in ambient air. The results provide a basis for laboratories evaluating this target list for ambient-air and facility-boundary investigations.
Laboratory workflow
Canister samples are introduced through the autosampler to the Nutech 8910. The preconcentrator enriches the target compounds before transfer to the GC-MS. Separate supporting operations prepare clean canisters and calibration standards.
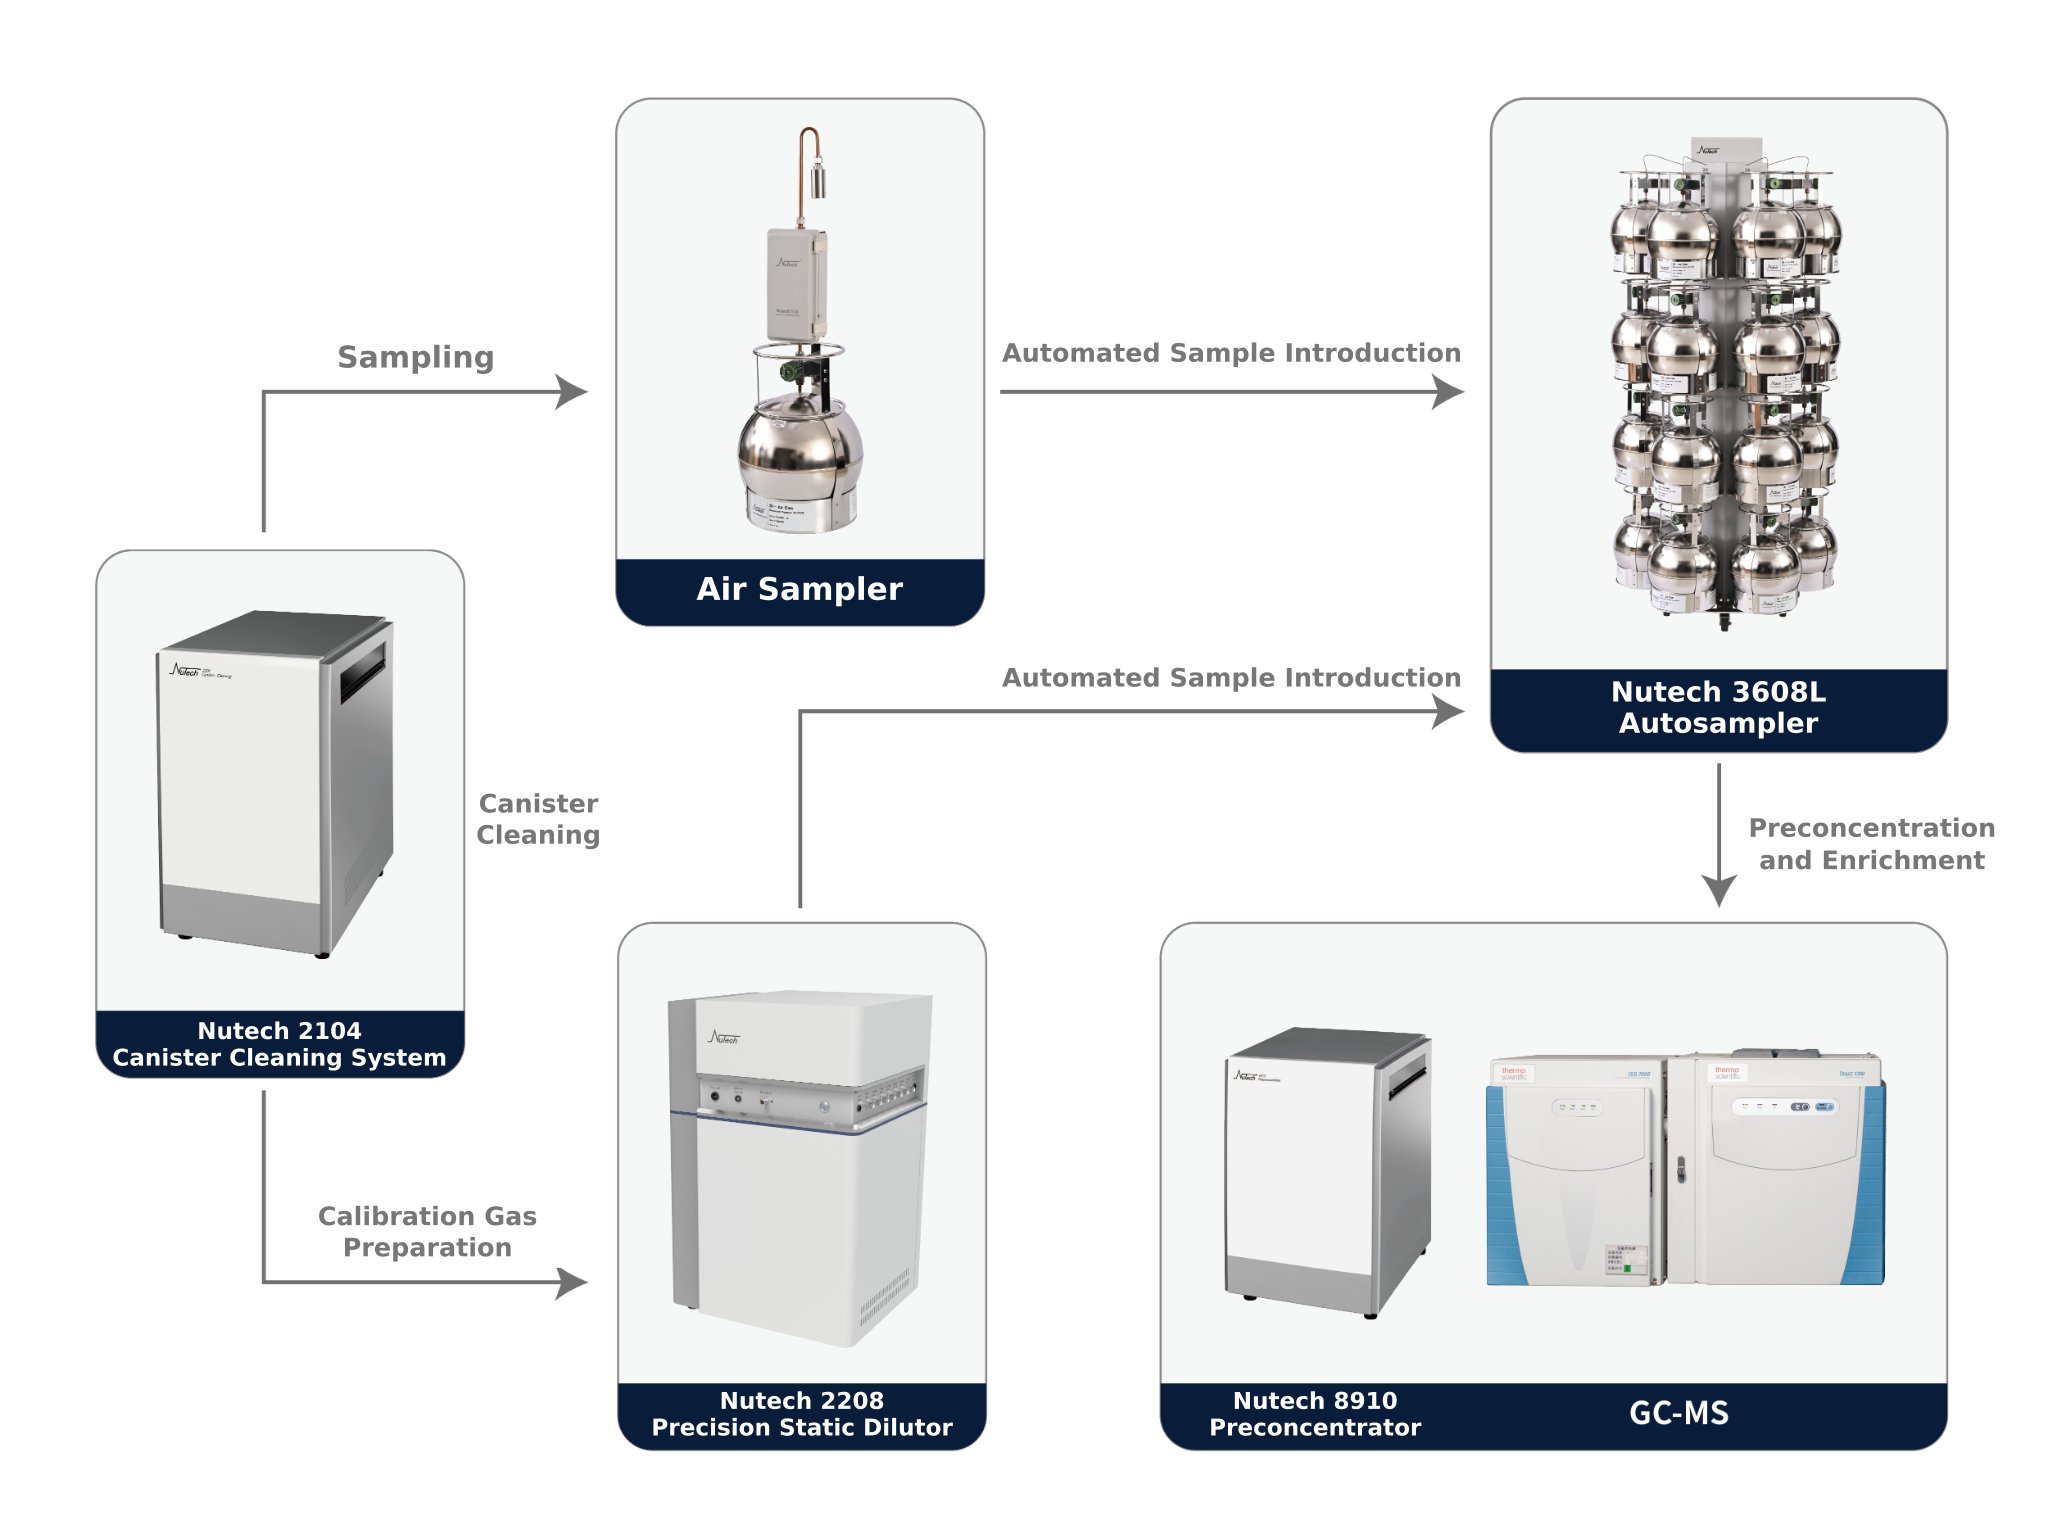
| Laboratory operation | Equipment | Function |
| Canister preparation | Nutech 2104 | Automated canister cleaning |
| Calibration preparation | Nutech 2208 | Gas-standard dilution |
| Sample introduction | Nutech 3608L | Automated canister sample introduction |
| Preconcentration | Nutech 8910 | Three-stage cryogenic enrichment |
| Separation and detection | GC-MS | Chromatographic separation and mass spectral analysis |
Experimental conditions
Table 1. Preconcentrator settings
| Stage | Trapping temperature | Desorption condition |
| First trap | −40 °C | 30 °C |
| Second trap | −80 °C | 230 °C |
| Third trap | −185 °C | 30 s desorption time |
Table 2. GC-MS settings and gases
| Parameter | Setting |
| GC column | DB-624 |
| Oven program | 35 °C for 5 min; 5 °C/min to 150 °C, hold 7 min; 10 °C/min to 200 °C, hold 4 min |
| Ionization | Electron ionization (EI) |
| Ion source temperature | 300 °C |
| Acquisition mode | Full scan |
| Gases | Nitrogen and helium, each ≥99.999% purity |
The oven program was used for a standard mixture containing the 11 target compounds and additional VOCs. Any shorter program for a narrower target list should be verified separately.
Chromatographic analysis
Figure 1 shows the mixed-standard chromatogram. The numbered target peaks are identified in Table 4.
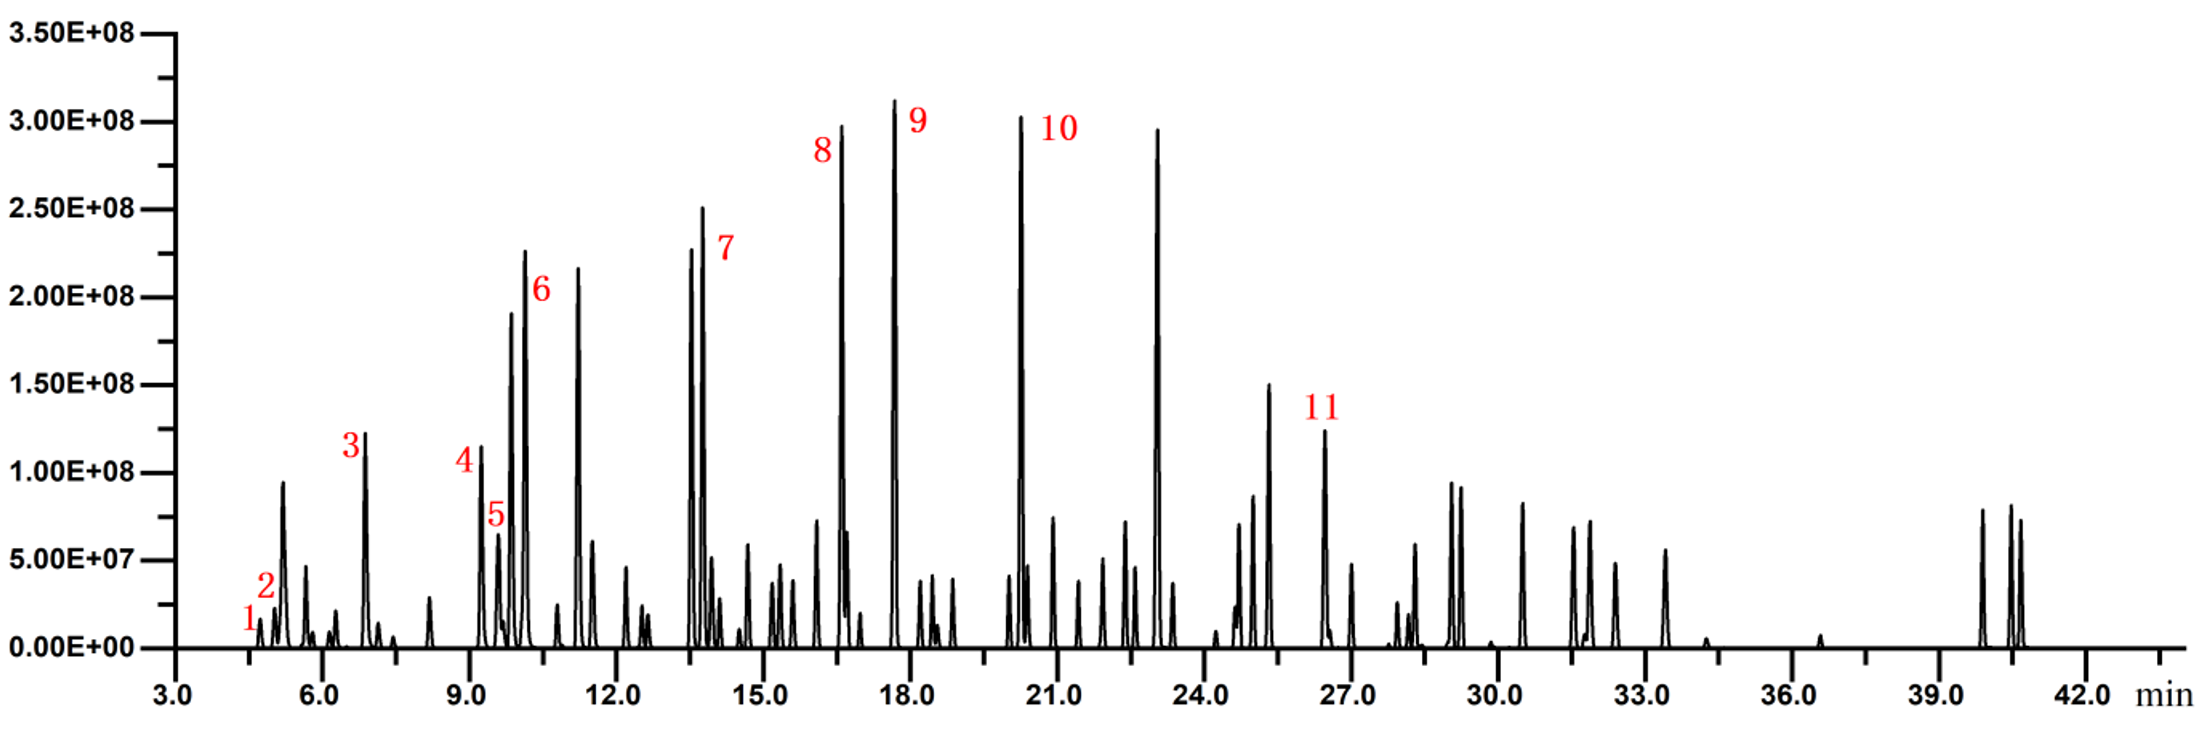
Figure 1. Chromatogram of the 11 target compounds in a VOC standard mixture.
Calibration design
Table 3. Equivalent calibration concentrations in nmol/mol
| Target group | II 50 mL | II 100 mL | II 200 mL | I 100 mL | I 200 mL | I 400 mL |
| H2S | 2.50 | 5.00 | 10.0 | 25.0 | 50.0 | 100 |
| Thiols | 1.25 | 2.50 | 5.00 | 12.5 | 25.0 | 50.0 |
| Other targets | 0.250 | 0.500 | 1.00 | 2.50 | 5.00 | 10.0 |
I and II identify the two working standard mixtures. H2S = hydrogen sulfide; thiols = methanethiol and ethanethiol; other targets = the remaining eight compounds in Table 4. The listed volumes are actual standard-mixture loading volumes.
Linearity and method detection limits
The 11 compounds gave calibration correlation coefficients r of 0.9994–1.0000. Table 4 lists the compound identities and reported method detection limits. These limits apply to the study configuration.
Table 4. Target compounds and analytical performance
| Peak | Compound | CAS number | r | MDL µg/m³ |
| 1 | Hydrogen sulfide | 7783-06-4 | 0.9998 | 0.2 |
| 2 | Carbonyl sulfide | 463-58-1 | 0.9999 | 0.3 |
| 3 | Methanethiol | 74-93-1 | 0.9997 | 0.2 |
| 4 | Ethanethiol | 75-08-1 | 0.9998 | 0.3 |
| 5 | Dimethyl sulfide | 75-18-3 | 1.0000 | 0.3 |
| 6 | Carbon disulfide | 75-15-0 | 0.9997 | 0.3 |
| 7 | Ethyl methyl sulfide | 624-89-5 | 1.0000 | 0.3 |
| 8 | Thiophene | 110-02-1 | 0.9995 | 0.4 |
| 9 | Diethyl sulfide | 352-93-2 | 0.9994 | 0.4 |
| 10 | Dimethyl disulfide | 624-92-0 | 0.9998 | 0.4 |
| 11 | Styrene | 100-42-5 | 0.9997 | 0.5 |
Methanethiol and ethanethiol are also known as methyl mercaptan and ethyl mercaptan. Ethyl methyl sulfide is also called methyl ethyl sulfide.
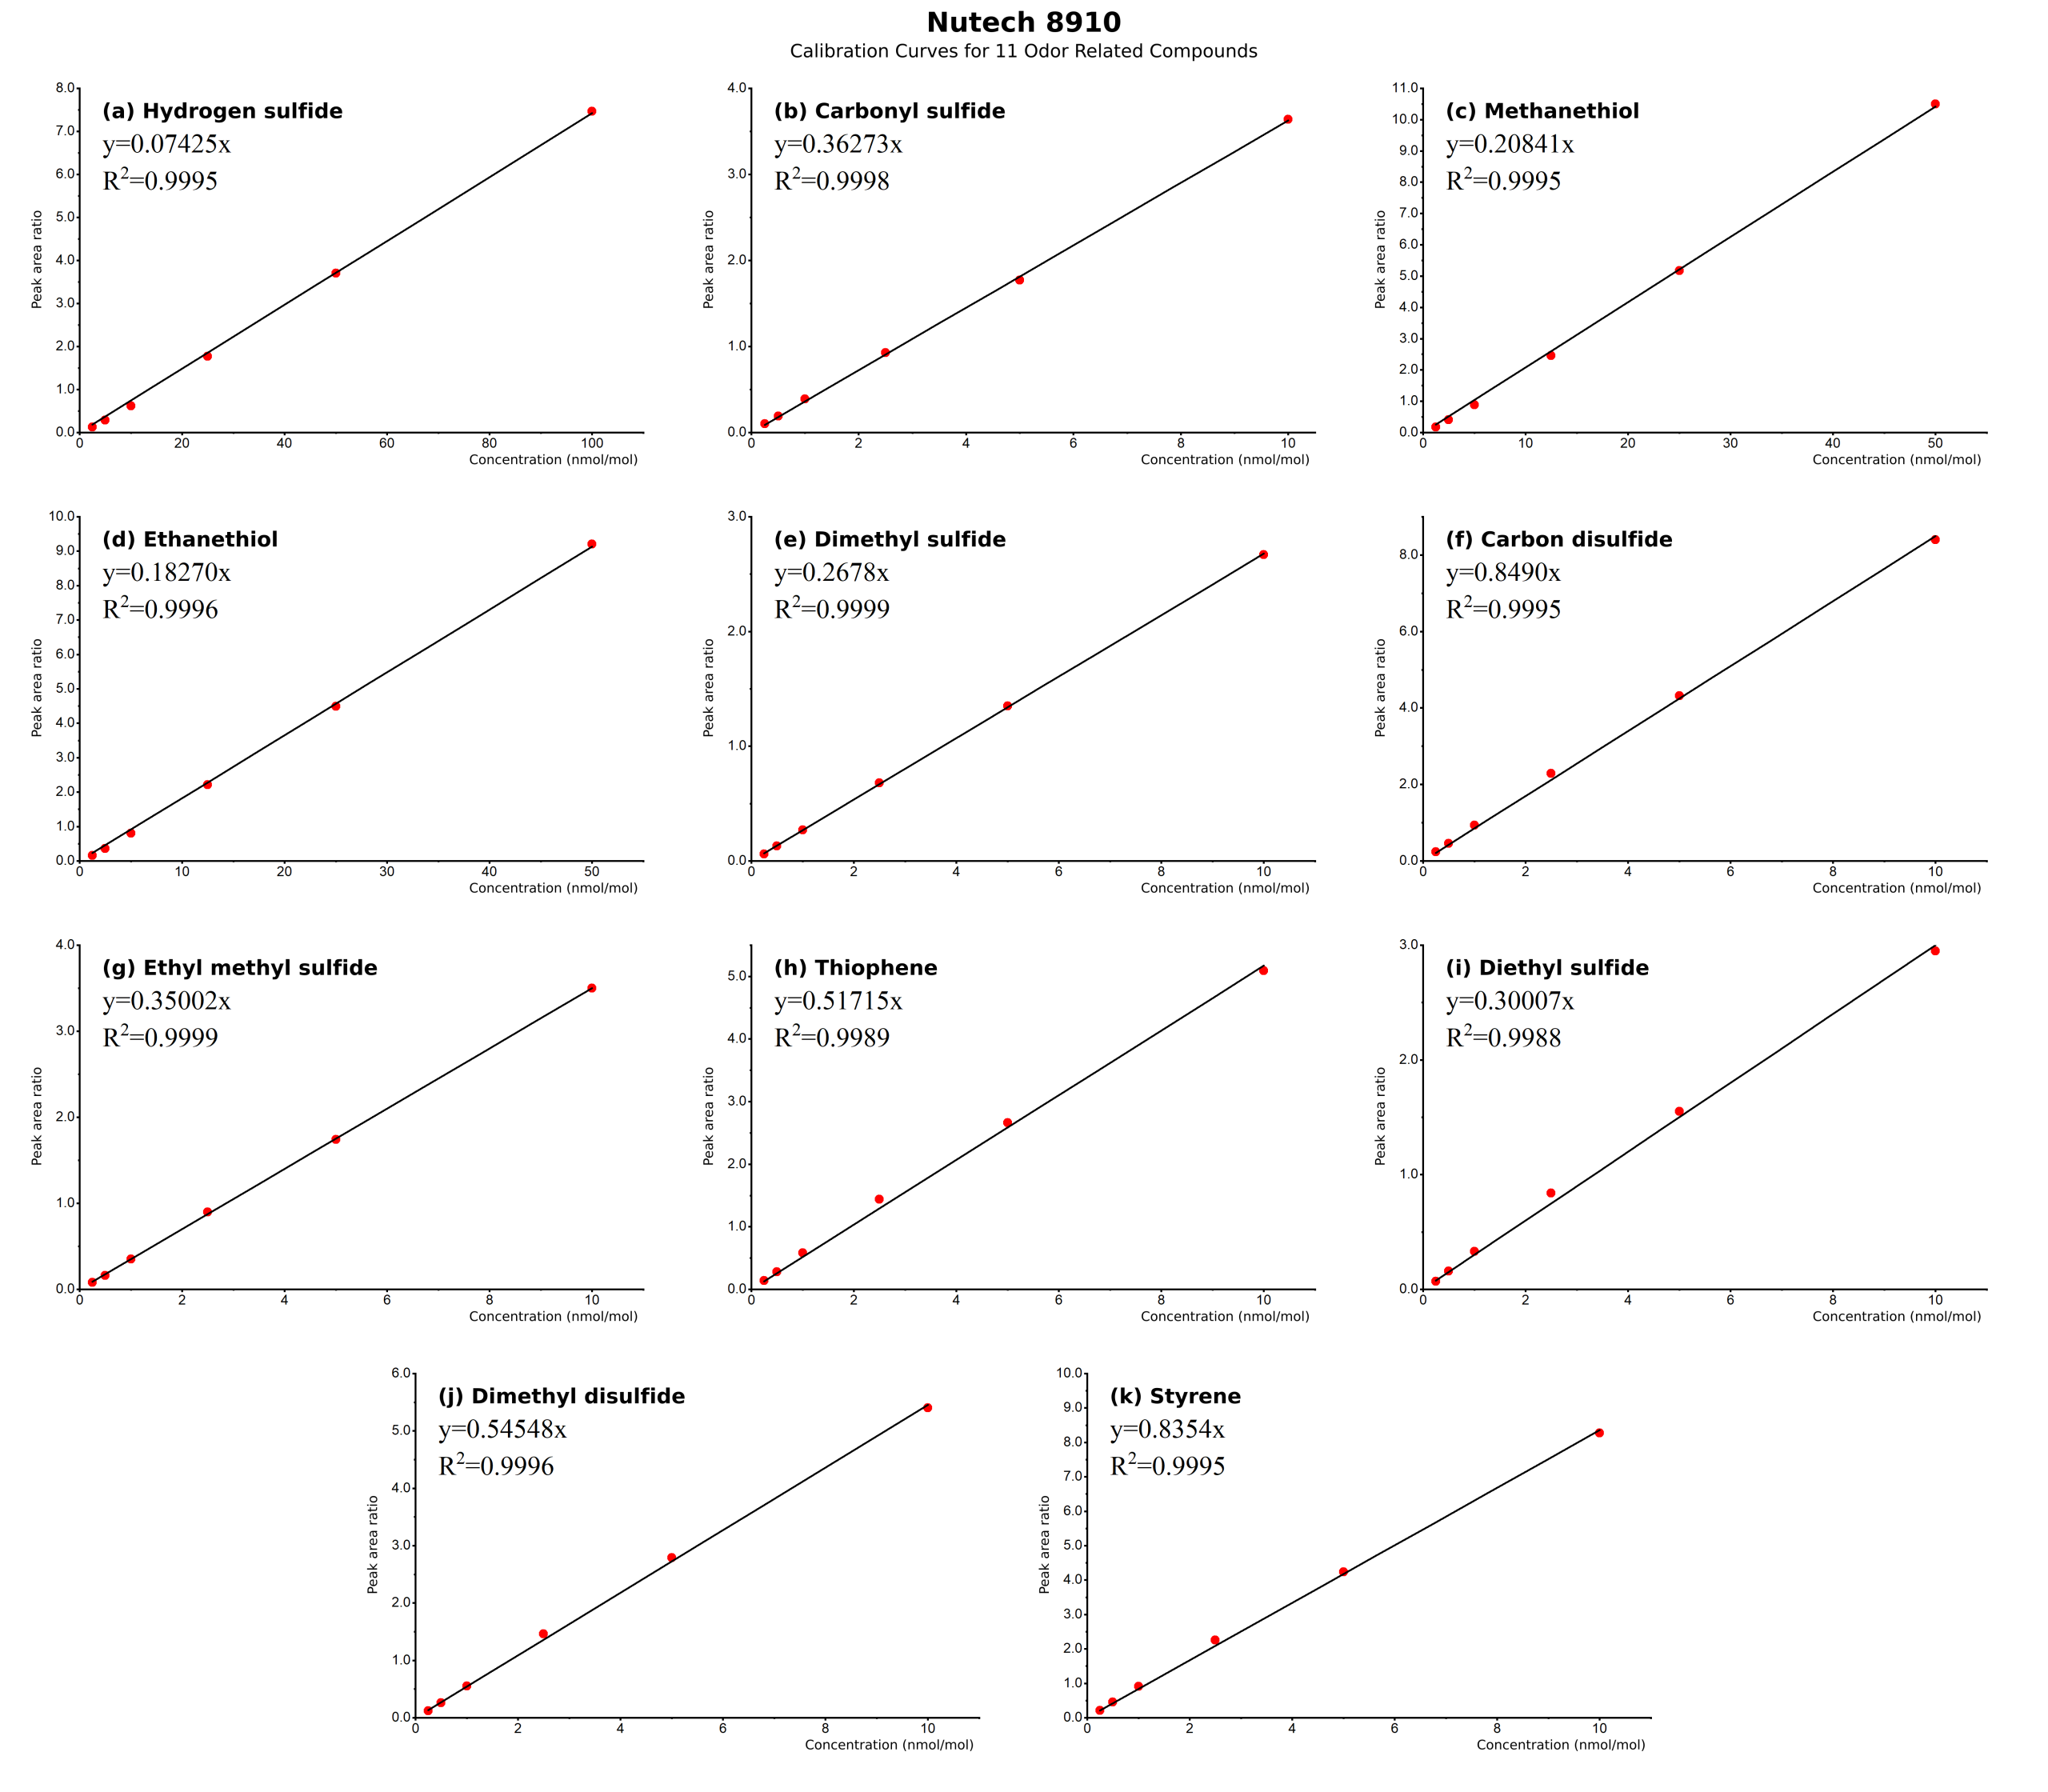
Detection limit assessment
Precision and matrix spike recovery
Nitrogen samples were tested at low, medium, and high concentrations. Ambient-air samples were tested at low and high concentrations. Each compound and test condition was measured six times. Table 5 summarizes the ranges across the 11 compounds; all 55 sets of results are provided in the appendix.
Table 5. Precision and spike recovery by test condition
| Matrix | Level | RSD range % | Recovery range % |
| Nitrogen | Low | 0.93–2.20 | 81.61–116.20 |
| Nitrogen | Medium | 0.65–1.98 | 103.02–116.70 |
| Nitrogen | High | 1.07–5.74 | 100.83–113.64 |
| Ambient air | Low | 0.64–8.49 | 71.71–108.03 |
| Ambient air | High | 0.90–7.52 | 67.70–122.89 |
All reported RSD values were below 10%. Recovery was compound- and matrix-dependent. For example, methanethiol in ambient air at the 40.0 nmol/mol spike level had an RSD of 2.69% and a recovery of 67.70%. Repeatability and recovery should therefore be evaluated separately when establishing laboratory quality-control criteria.
Conclusion
The Nutech 8910 coupled to GC-MS enabled analysis of 11 odor-related compounds with reported MDLs of 0.2–0.5 µg/m³, correlation coefficients r of 0.9994–1.0000, and RSD values below 10% in the reported tests. The calibration and matrix-spike results provide a practical starting point for laboratories adding these compounds to canister-based air analysis. Routine implementation should verify blanks, carryover, sample stability, and matrix-specific recovery for the intended sampling and reporting conditions.
Appendix Detailed precision and recovery results
Each row represents a condition tested with six replicate measurements. N2 denotes high-purity nitrogen; Air denotes the ambient-air matrix. Added and measured concentrations are in nmol/mol. RSD and recovery are percentages. Measured concentrations are rounded, so ratios calculated from the displayed values may differ slightly from the reported recovery percentages.
Table 6. Compound-specific precision and spike recovery data
| Compound | Matrix | Added nmol/mol | Measured nmol/mol | RSD % | Recovery % |
| Hydrogen sulfide | N2 | 5.00 | 4.23 | 2.20 | 84.65 |
| Hydrogen sulfide | N2 | 20.0 | 20.6 | 0.65 | 103.21 |
| Hydrogen sulfide | N2 | 80.0 | 84.3 | 5.74 | 105.38 |
| Hydrogen sulfide | Air | 20.0 | 15.3 | 1.13 | 76.67 |
| Hydrogen sulfide | Air | 80.0 | 85.1 | 1.87 | 106.33 |
| Carbonyl sulfide | N2 | 0.50 | 0.54 | 0.95 | 107.86 |
| Carbonyl sulfide | N2 | 2.00 | 2.08 | 1.91 | 103.90 |
| Carbonyl sulfide | N2 | 8.00 | 8.16 | 3.43 | 101.95 |
| Carbonyl sulfide | Air | 2.00 | 2.06 | 1.24 | 103.15 |
| Carbonyl sulfide | Air | 8.00 | 9.76 | 2.75 | 122.00 |
| Methanethiol | N2 | 2.50 | 2.04 | 1.25 | 81.61 |
| Methanethiol | N2 | 10.0 | 10.6 | 1.93 | 106.37 |
| Methanethiol | N2 | 40.0 | 45.5 | 1.19 | 113.64 |
| Methanethiol | Air | 10.0 | 7.17 | 8.49 | 71.71 |
| Methanethiol | Air | 40.0 | 27.1 | 2.69 | 67.70 |
| Ethanethiol | N2 | 2.50 | 2.14 | 0.93 | 85.51 |
| Ethanethiol | N2 | 10.0 | 10.6 | 1.61 | 106.54 |
| Ethanethiol | N2 | 40.0 | 44.4 | 1.21 | 111.01 |
| Ethanethiol | Air | 10.0 | 9.85 | 7.14 | 98.51 |
| Ethanethiol | Air | 40.0 | 40.8 | 1.59 | 101.95 |
| Dimethyl sulfide | N2 | 0.50 | 0.47 | 1.10 | 93.15 |
| Dimethyl sulfide | N2 | 2.00 | 2.07 | 1.17 | 103.34 |
| Dimethyl sulfide | N2 | 8.00 | 8.27 | 1.59 | 103.34 |
| Dimethyl sulfide | Air | 2.00 | 1.91 | 0.82 | 95.48 |
| Dimethyl sulfide | Air | 8.00 | 7.52 | 0.90 | 93.96 |
| Carbon disulfide | N2 | 0.50 | 0.53 | 1.13 | 106.57 |
| Carbon disulfide | N2 | 2.00 | 2.18 | 1.54 | 108.76 |
| Carbon disulfide | N2 | 8.00 | 8.23 | 1.77 | 102.92 |
| Carbon disulfide | Air | 2.00 | 2.02 | 0.99 | 100.96 |
| Carbon disulfide | Air | 8.00 | 8.03 | 1.81 | 100.36 |
| Ethyl methyl sulfide | N2 | 0.50 | 0.46 | 1.44 | 91.20 |
| Ethyl methyl sulfide | N2 | 2.00 | 2.06 | 1.38 | 103.02 |
| Ethyl methyl sulfide | N2 | 8.00 | 8.24 | 1.62 | 103.04 |
| Ethyl methyl sulfide | Air | 2.00 | 1.91 | 0.90 | 95.32 |
| Ethyl methyl sulfide | Air | 8.00 | 7.68 | 1.75 | 96.00 |
| Thiophene | N2 | 0.50 | 0.52 | 1.05 | 103.79 |
| Thiophene | N2 | 2.00 | 2.27 | 1.98 | 113.65 |
| Thiophene | N2 | 8.00 | 8.22 | 1.07 | 102.79 |
| Thiophene | Air | 2.00 | 1.94 | 0.64 | 96.81 |
| Thiophene | Air | 8.00 | 8.86 | 3.15 | 110.76 |
| Diethyl sulfide | N2 | 0.50 | 0.50 | 1.43 | 99.68 |
| Diethyl sulfide | N2 | 2.00 | 2.31 | 1.35 | 115.59 |
| Diethyl sulfide | N2 | 8.00 | 8.38 | 2.37 | 104.80 |
| Diethyl sulfide | Air | 2.00 | 2.01 | 1.05 | 100.27 |
| Diethyl sulfide | Air | 8.00 | 9.06 | 7.39 | 113.21 |
| Dimethyl disulfide | N2 | 0.50 | 0.44 | 1.09 | 88.14 |
| Dimethyl disulfide | N2 | 2.00 | 2.12 | 1.38 | 106.22 |
| Dimethyl disulfide | N2 | 8.00 | 8.18 | 1.77 | 102.25 |
| Dimethyl disulfide | Air | 2.00 | 1.80 | 0.67 | 90.14 |
| Dimethyl disulfide | Air | 8.00 | 9.44 | 7.52 | 117.98 |
| Styrene | N2 | 0.50 | 0.58 | 1.56 | 116.20 |
| Styrene | N2 | 2.00 | 2.33 | 1.73 | 116.70 |
| Styrene | N2 | 8.00 | 8.07 | 3.11 | 100.83 |
| Styrene | Air | 2.00 | 2.16 | 0.95 | 108.03 |
| Styrene | Air | 8.00 | 9.83 | 1.21 | 122.89 |


